
Week 2:
Calculating and Displaying Descriptive Statistics: managers use different statistics to describe or summarize data. Measures like the mean, median, mode, standard deviation, variance, range, interquartile range are all used for different reasons. Frequency distributions and graphical depictions can also be valuable tools to summarize data.
Learning Objectives:
- Basic descriptive statistics used to describe data:
Measures of central tendency
- https://statistics.laerd.com/statistical-guides/measures-central-tendency-mean-mode-median.php
- Also, see FAQs on p. 2
Measure of location
Measures of spread
- Sample standard deviation
- http://www.stats.gla.ac.uk/steps/glossary/presenting_data.html#standev
- Sample Variance
- http://www.stats.gla.ac.uk/steps/glossary/presenting_data.html#sampvar
- Range
- http://www.stats.gla.ac.uk/steps/glossary/presenting_data.html#range
- Interquartile range
- http://www.stats.gla.ac.uk/steps/glossary/presenting_data.html#iqr
- Coefficient of Variation (CV)
- http://www.stats.gla.ac.uk/steps/glossary/presenting_data.html#coeffvar
- COMPUTE descriptive statistics
- Data Analysis Descriptive Statistics
- Check box Labels if first row of the data range is a label
- Check box Confidence Level for Mean for week 6, Confidence Intervals
- See Descriptive Statistics using Excel functions.xlsx in Course Content, Session 2
- Data Analysis Descriptive Statistics
- Build bar and pie charts for qualitative data
- Know how to construct a frequency distribution, cumulative frequency distribution
- Use the array function FREQUENCY
- Build Histograms for quantitative data
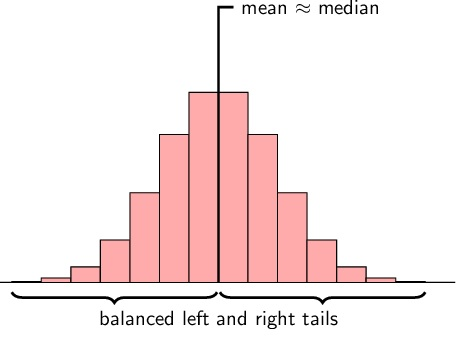
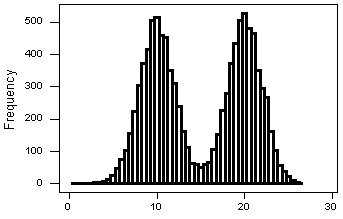
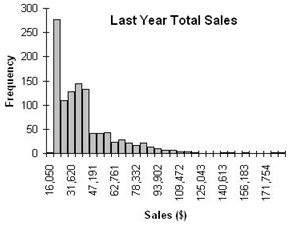
- A histogram is a graphical summary of numerical data which illustrates the center, spread, and shape (frequency or relative frequency vs. value) of the data, and can also help detect any unusual observations (outliers) or gaps in the data. The range of data values is partitioned into sub ranges called bins. Frequency or relative frequency of observations in a bin is plotted vs. bin.
- Bins should be evenly spaced
- Discuss the different shapes of the basic frequency distributions and how to interpret them
- Symmetric Unimodal (one peak)
- Bimodal has 2 modes (peaks)
- Skewed left – Low values pull mean to left so mean < median
- Skewed right – High values pull mean to right so mean > median
Assignments:
Complete Homework 2. Find the problem set in the course content area, under week 2
Note: All Deliverables that are DUE THIS WEEK should be submitted to your assignment folder by Tuesday 11:59PM
Openstax Introductory Business Statistics Chapter 2
Measures of Spread
Relative Frequency Tables and Graphics for Describing Quantitative Data
Additional Reading:
Basic Descriptive Statistics
Using Excel to compute mean, standard deviation, and variance
/Coefficient of Variation
Measures of Dispersion for a population
- https://courses.lumenlearning.com/boundless-statistics/chapter/describing-variability/
- http://www.mathsrevision.net/advanced-level-maths-revision/statistics/measures-dispersion
Distributions
Frequency Tables
Box plots, stem and leaf